This year, and for the second year running, we asked our developer network all about who they are and what they do. Over 9000 developers took part. We were able to put together a detailed report on everything from education and learning to daily challenges, work life and trends.
Plus, for HR professionals, we were able to piece together an extra, exclusive, report. It’s packed with everything you need to know to source, screen and retain developers in 2019.

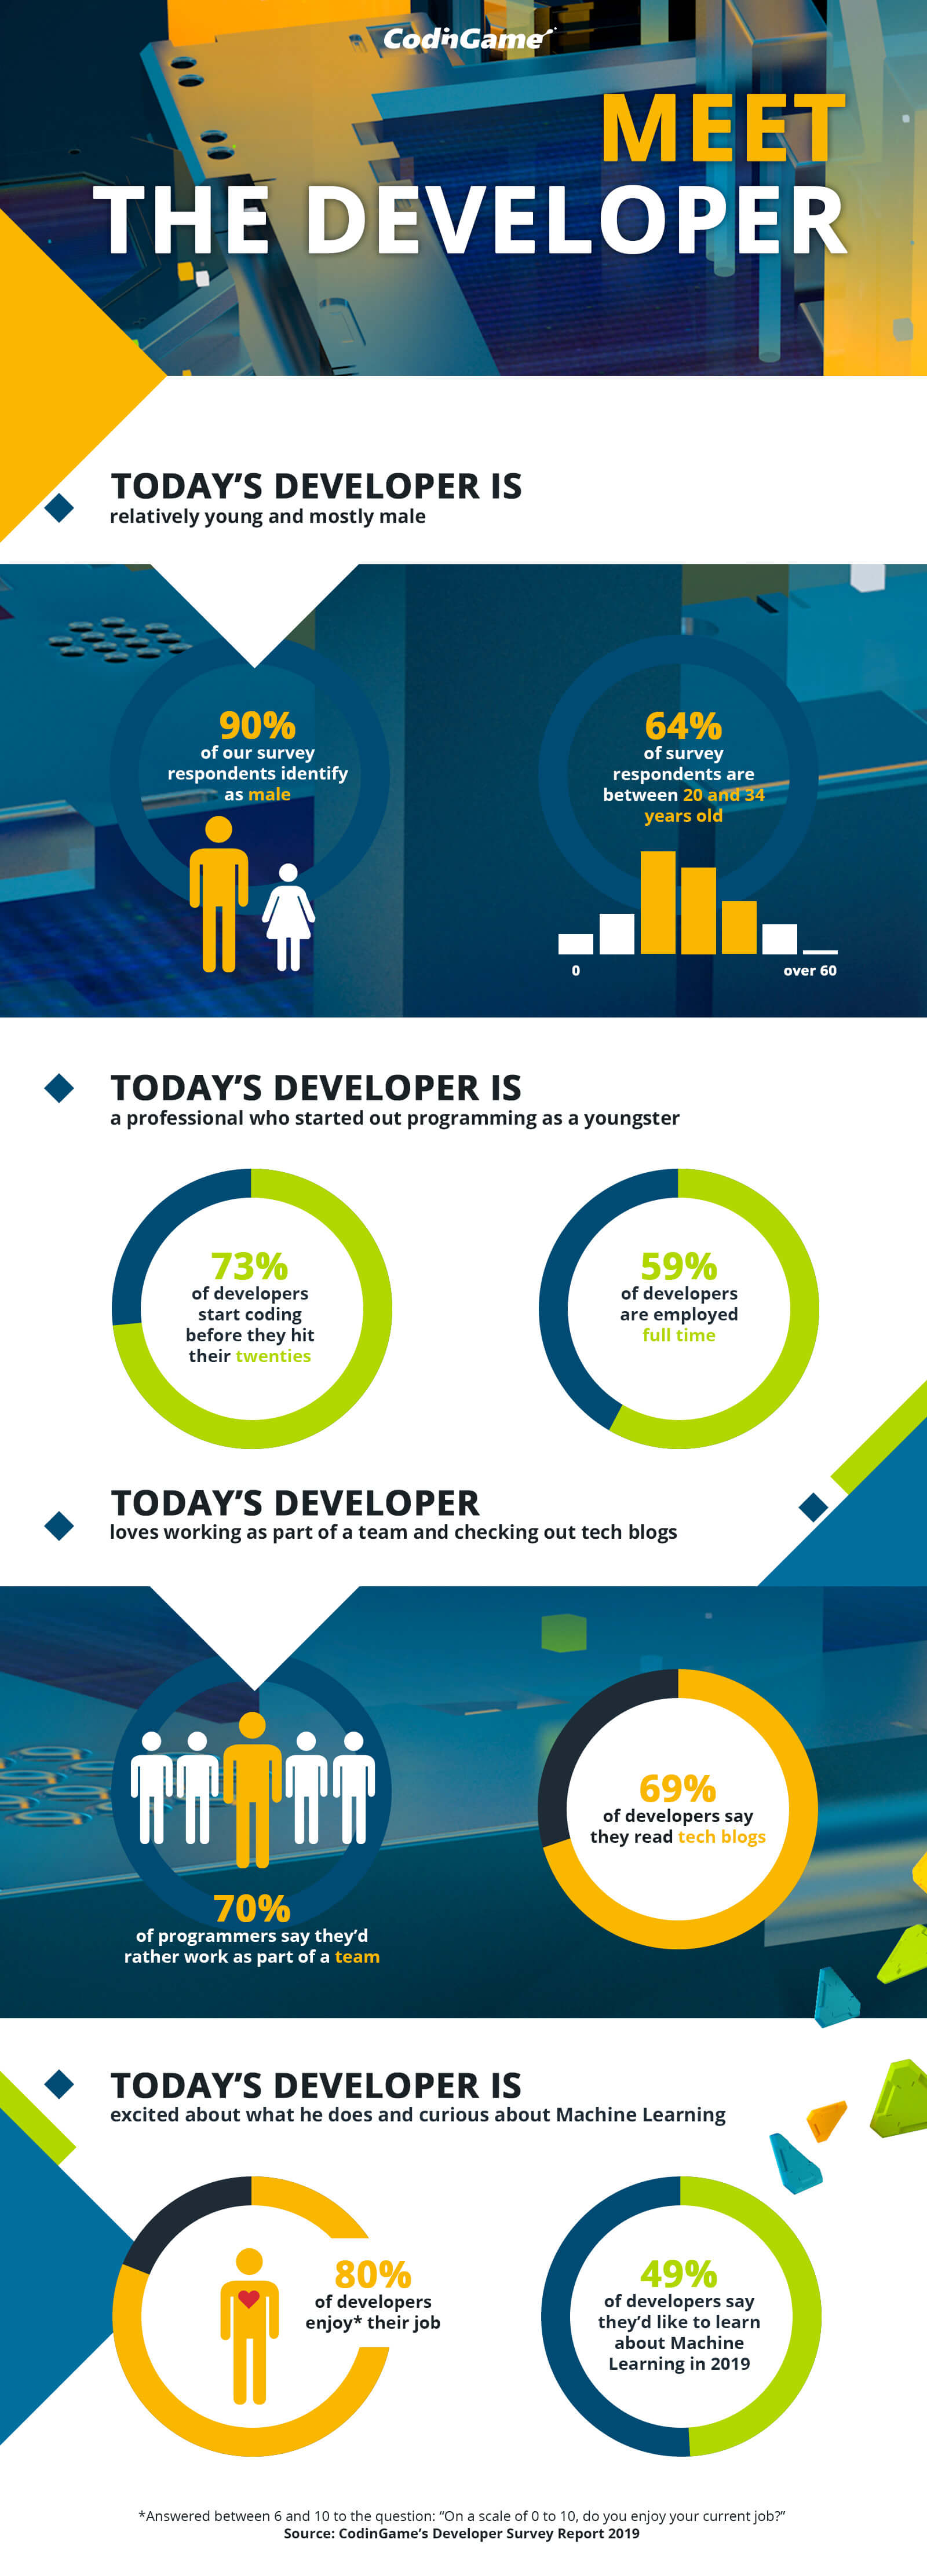
We’ve selected and brought together a few statistics, so as to sketch a picture of today’s developer in this infographic.
One second! Obviously, this infographic doesn’t show the whole picture. These statistics represent an average developer based on our results. There are all kinds of wonderful developers.
These highlights represent just a few of the fascinating insights CodinGame has been able to dig up. To get the whole story, head over to see the full report, bursting with more statistics, extra details and interesting analysis.


